Getting Started#
Info
This guide assumes no prior experience with Perses. For a high-level understanding of the project, see the Overview.
Install Perses#
Before you begin, you need a running Perses server. Choose the installation method that best fits your environment:
You will also need a running Prometheus instance that Perses can connect to.
For this tutorial, the quickest way to get both Perses and Prometheus running together is with Docker Compose. Save the following as docker-compose.yml:
services:
  perses:
    image: persesdev/perses
    ports:
      - "8080:8080"
  prometheus:
    image: prom/prometheus
    ports:
      - "9090:9090"
Then start both services:
Perses is now available at http://localhost:8080 and Prometheus at http://localhost:9090. Because both containers run on the same Compose network, Perses can reach Prometheus at http://prometheus:9090.
Your First Dashboard#
In this section you will create a project, configure a datasource, and build your first dashboard.
Create a Project#
A project is the top-level container for dashboards, datasources, and variables.
- On the home page, click + Create.
- Enter a name for your project, for example
my-first-project. - Click Add to create the project.
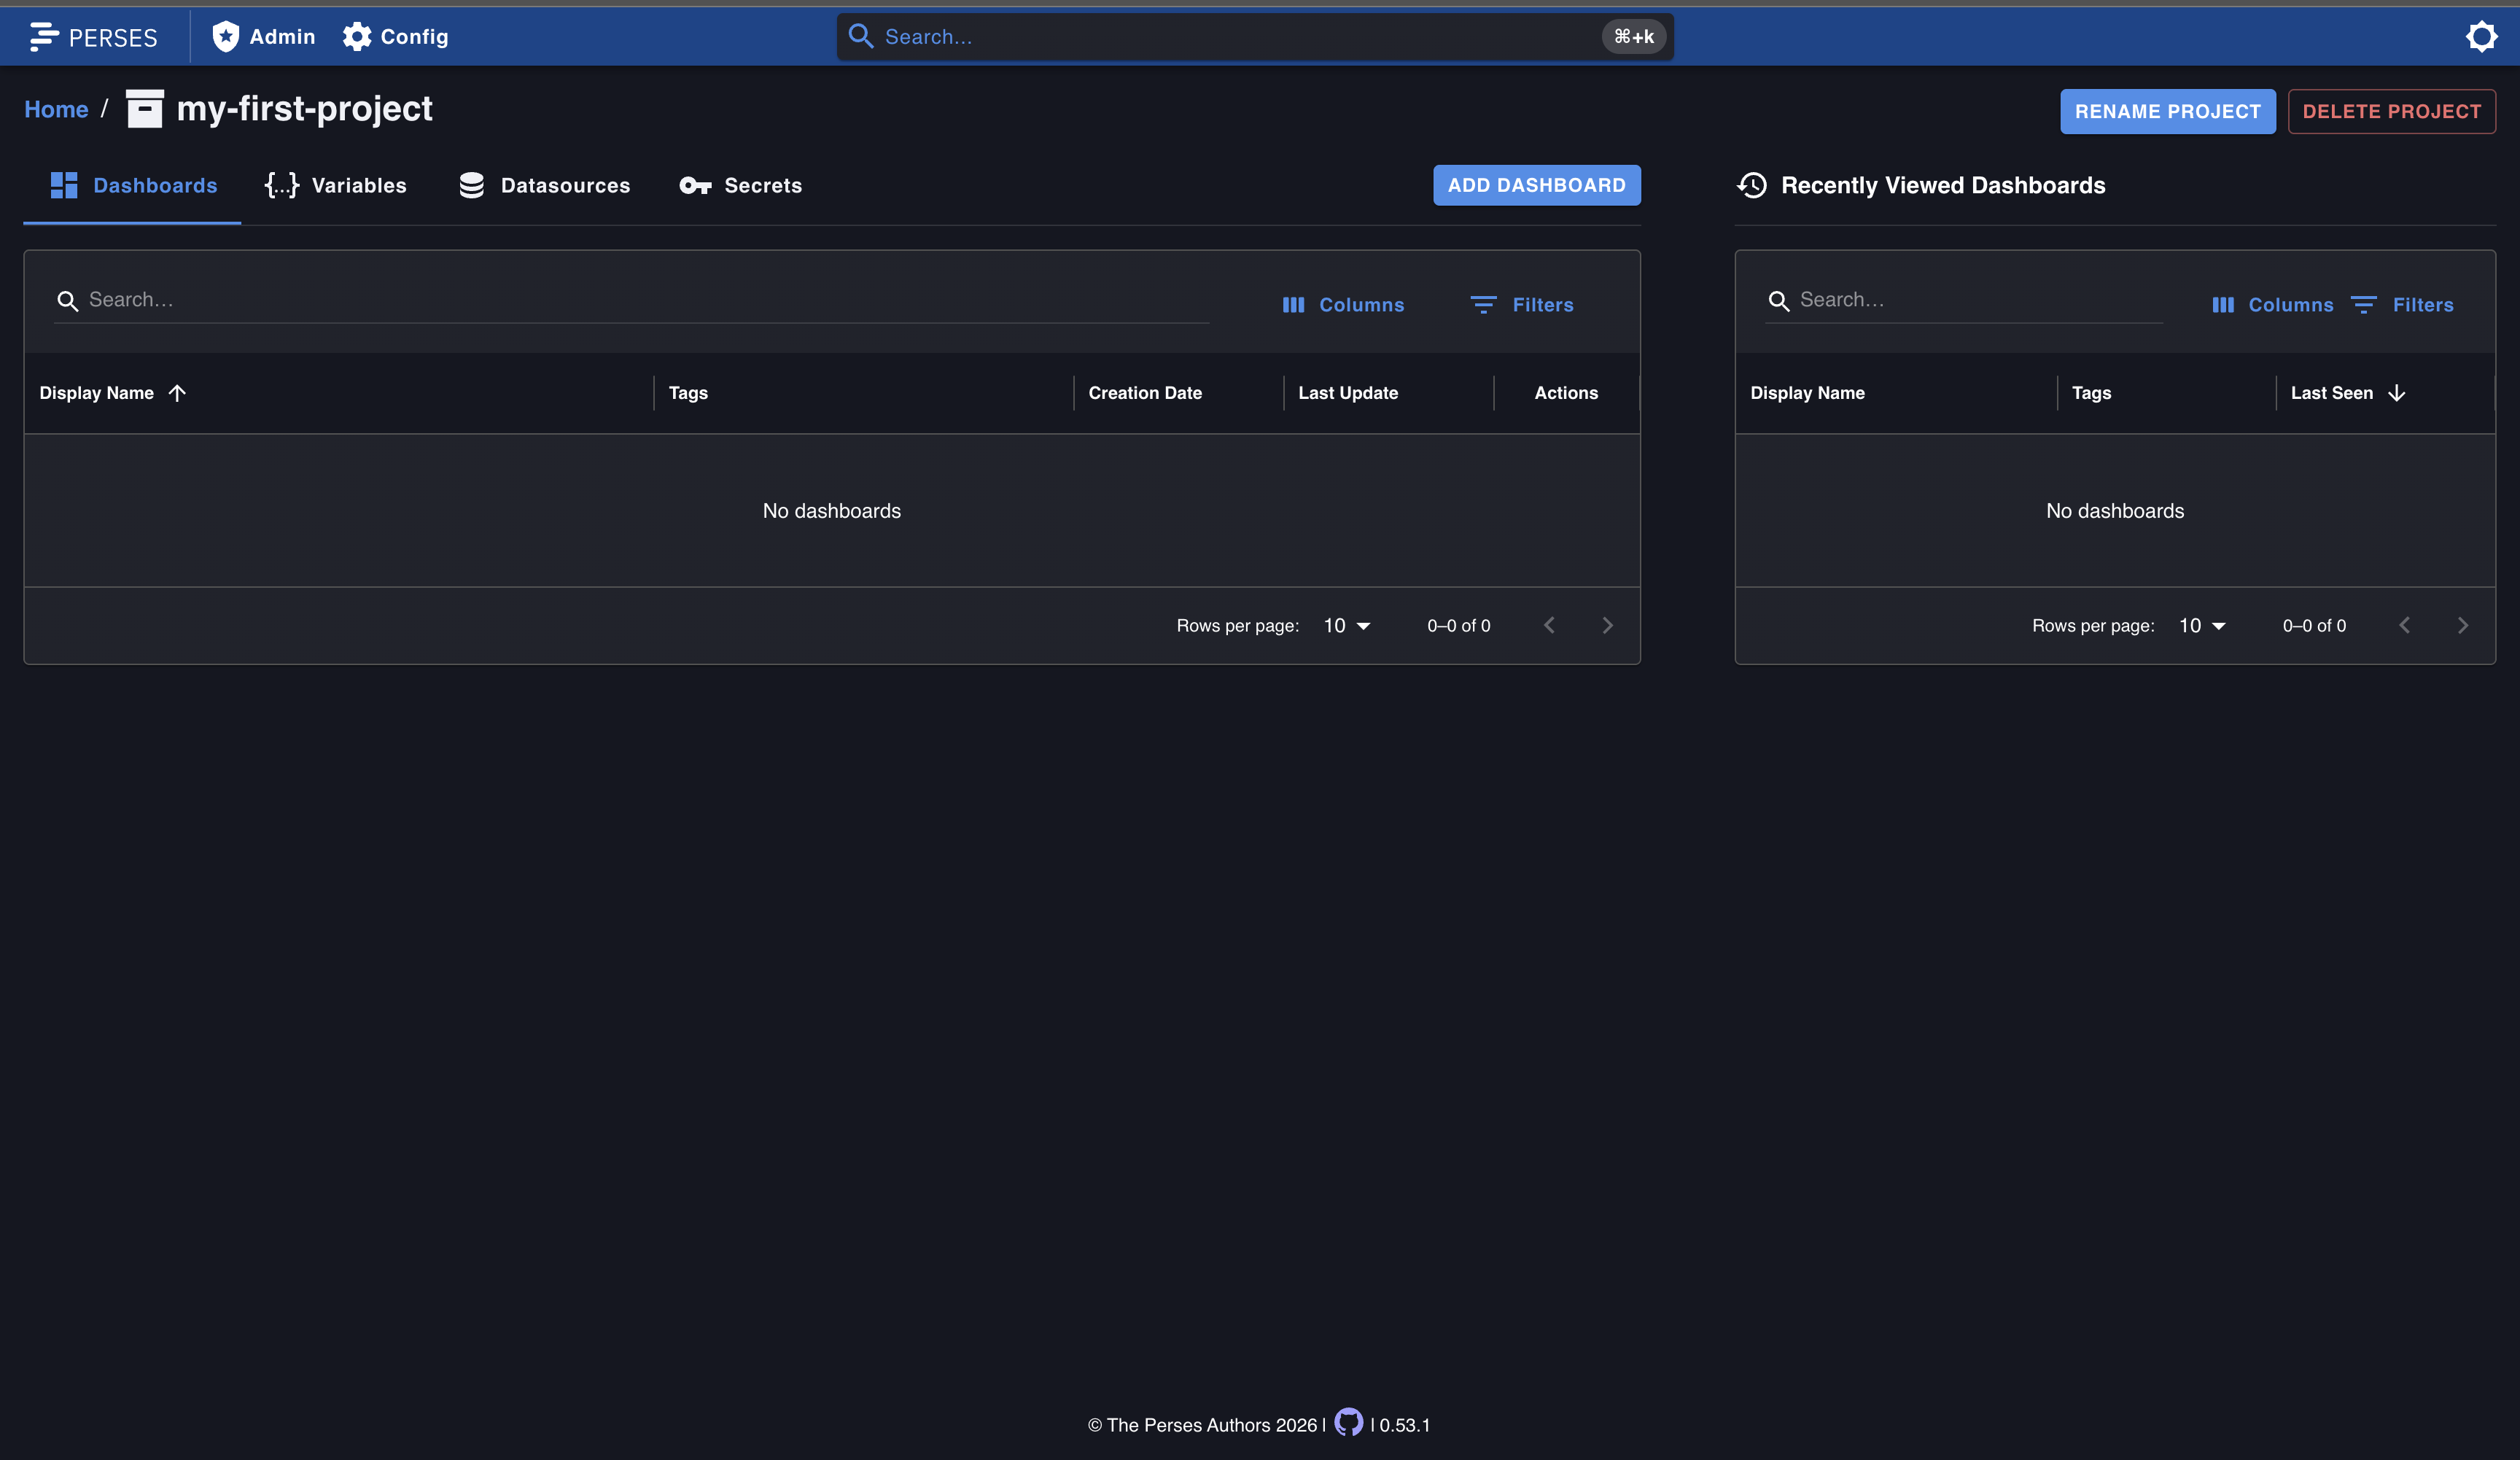
You are taken to the project page with tabs for Dashboards, Variables, Datasources, and Secrets.
Add a Datasource#
Before you can visualize data, you need to connect Perses to a datasource.
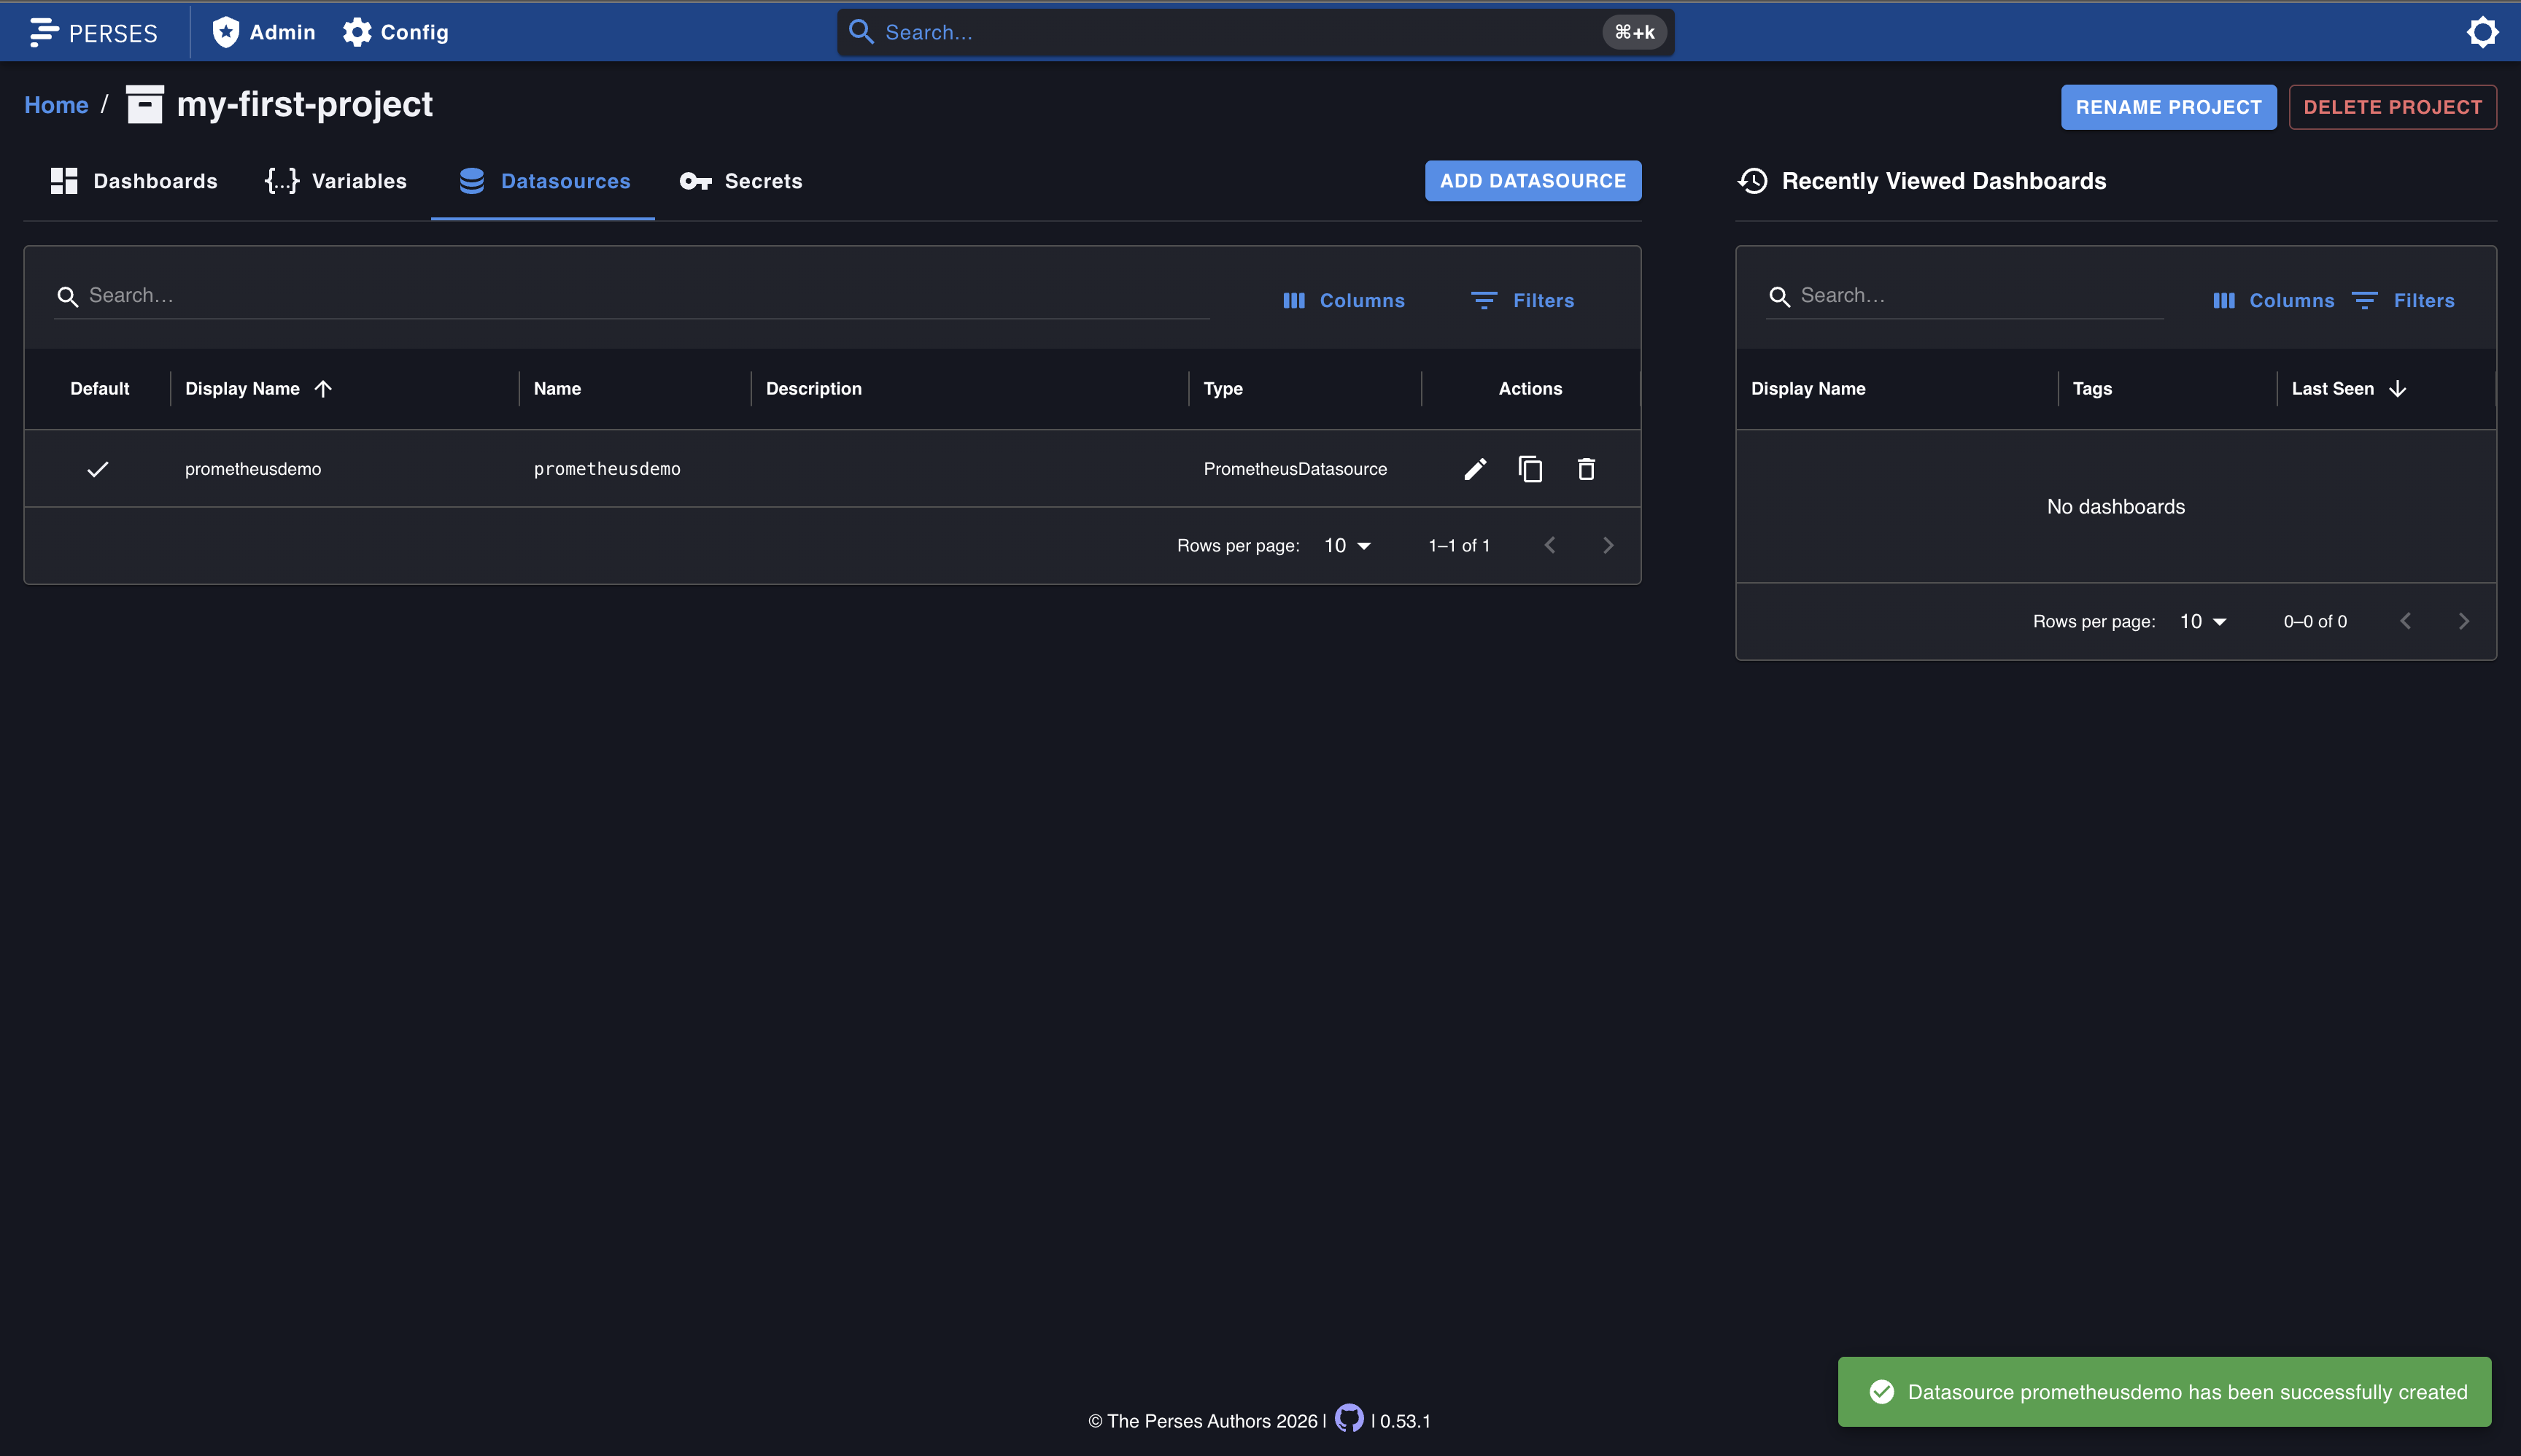
- Navigate to the Datasources tab in your project.
- Click Add Datasource.
- Fill in the following fields:
- Name: a name for your datasource, for example
PrometheusDemo. - Set as default: toggle on.
- Source: select
Prometheus Datasource. - HTTP Settings: select
Proxy. - URL: the URL of your Prometheus instance, for example
http://prometheus:9090.
- Name: a name for your datasource, for example
- Click Add to save.
Tip
Use Proxy mode so the Perses server forwards requests to Prometheus on your behalf. This avoids CORS issues that occur with Direct access mode when the browser cannot reach Prometheus directly.
Create a Dashboard#
- Navigate to the Dashboards tab in your project.
- Click Add Dashboard.
- Enter a name, for example
my-first-dashboard. - Click Add to create the dashboard.
You are taken to an empty dashboard in edit mode.
Add a Panel#
- Click Add Panel in the top-right toolbar.
- Fill in the following fields:
- Name:
HTTP Requests - Type:
Time Series Chart
- Name:
- Under Query, configure:
- Query Type:
Prometheus Time Series Query - Prometheus Datasource: your default datasource is pre-selected.
- PromQL Expression:
up
- Query Type:
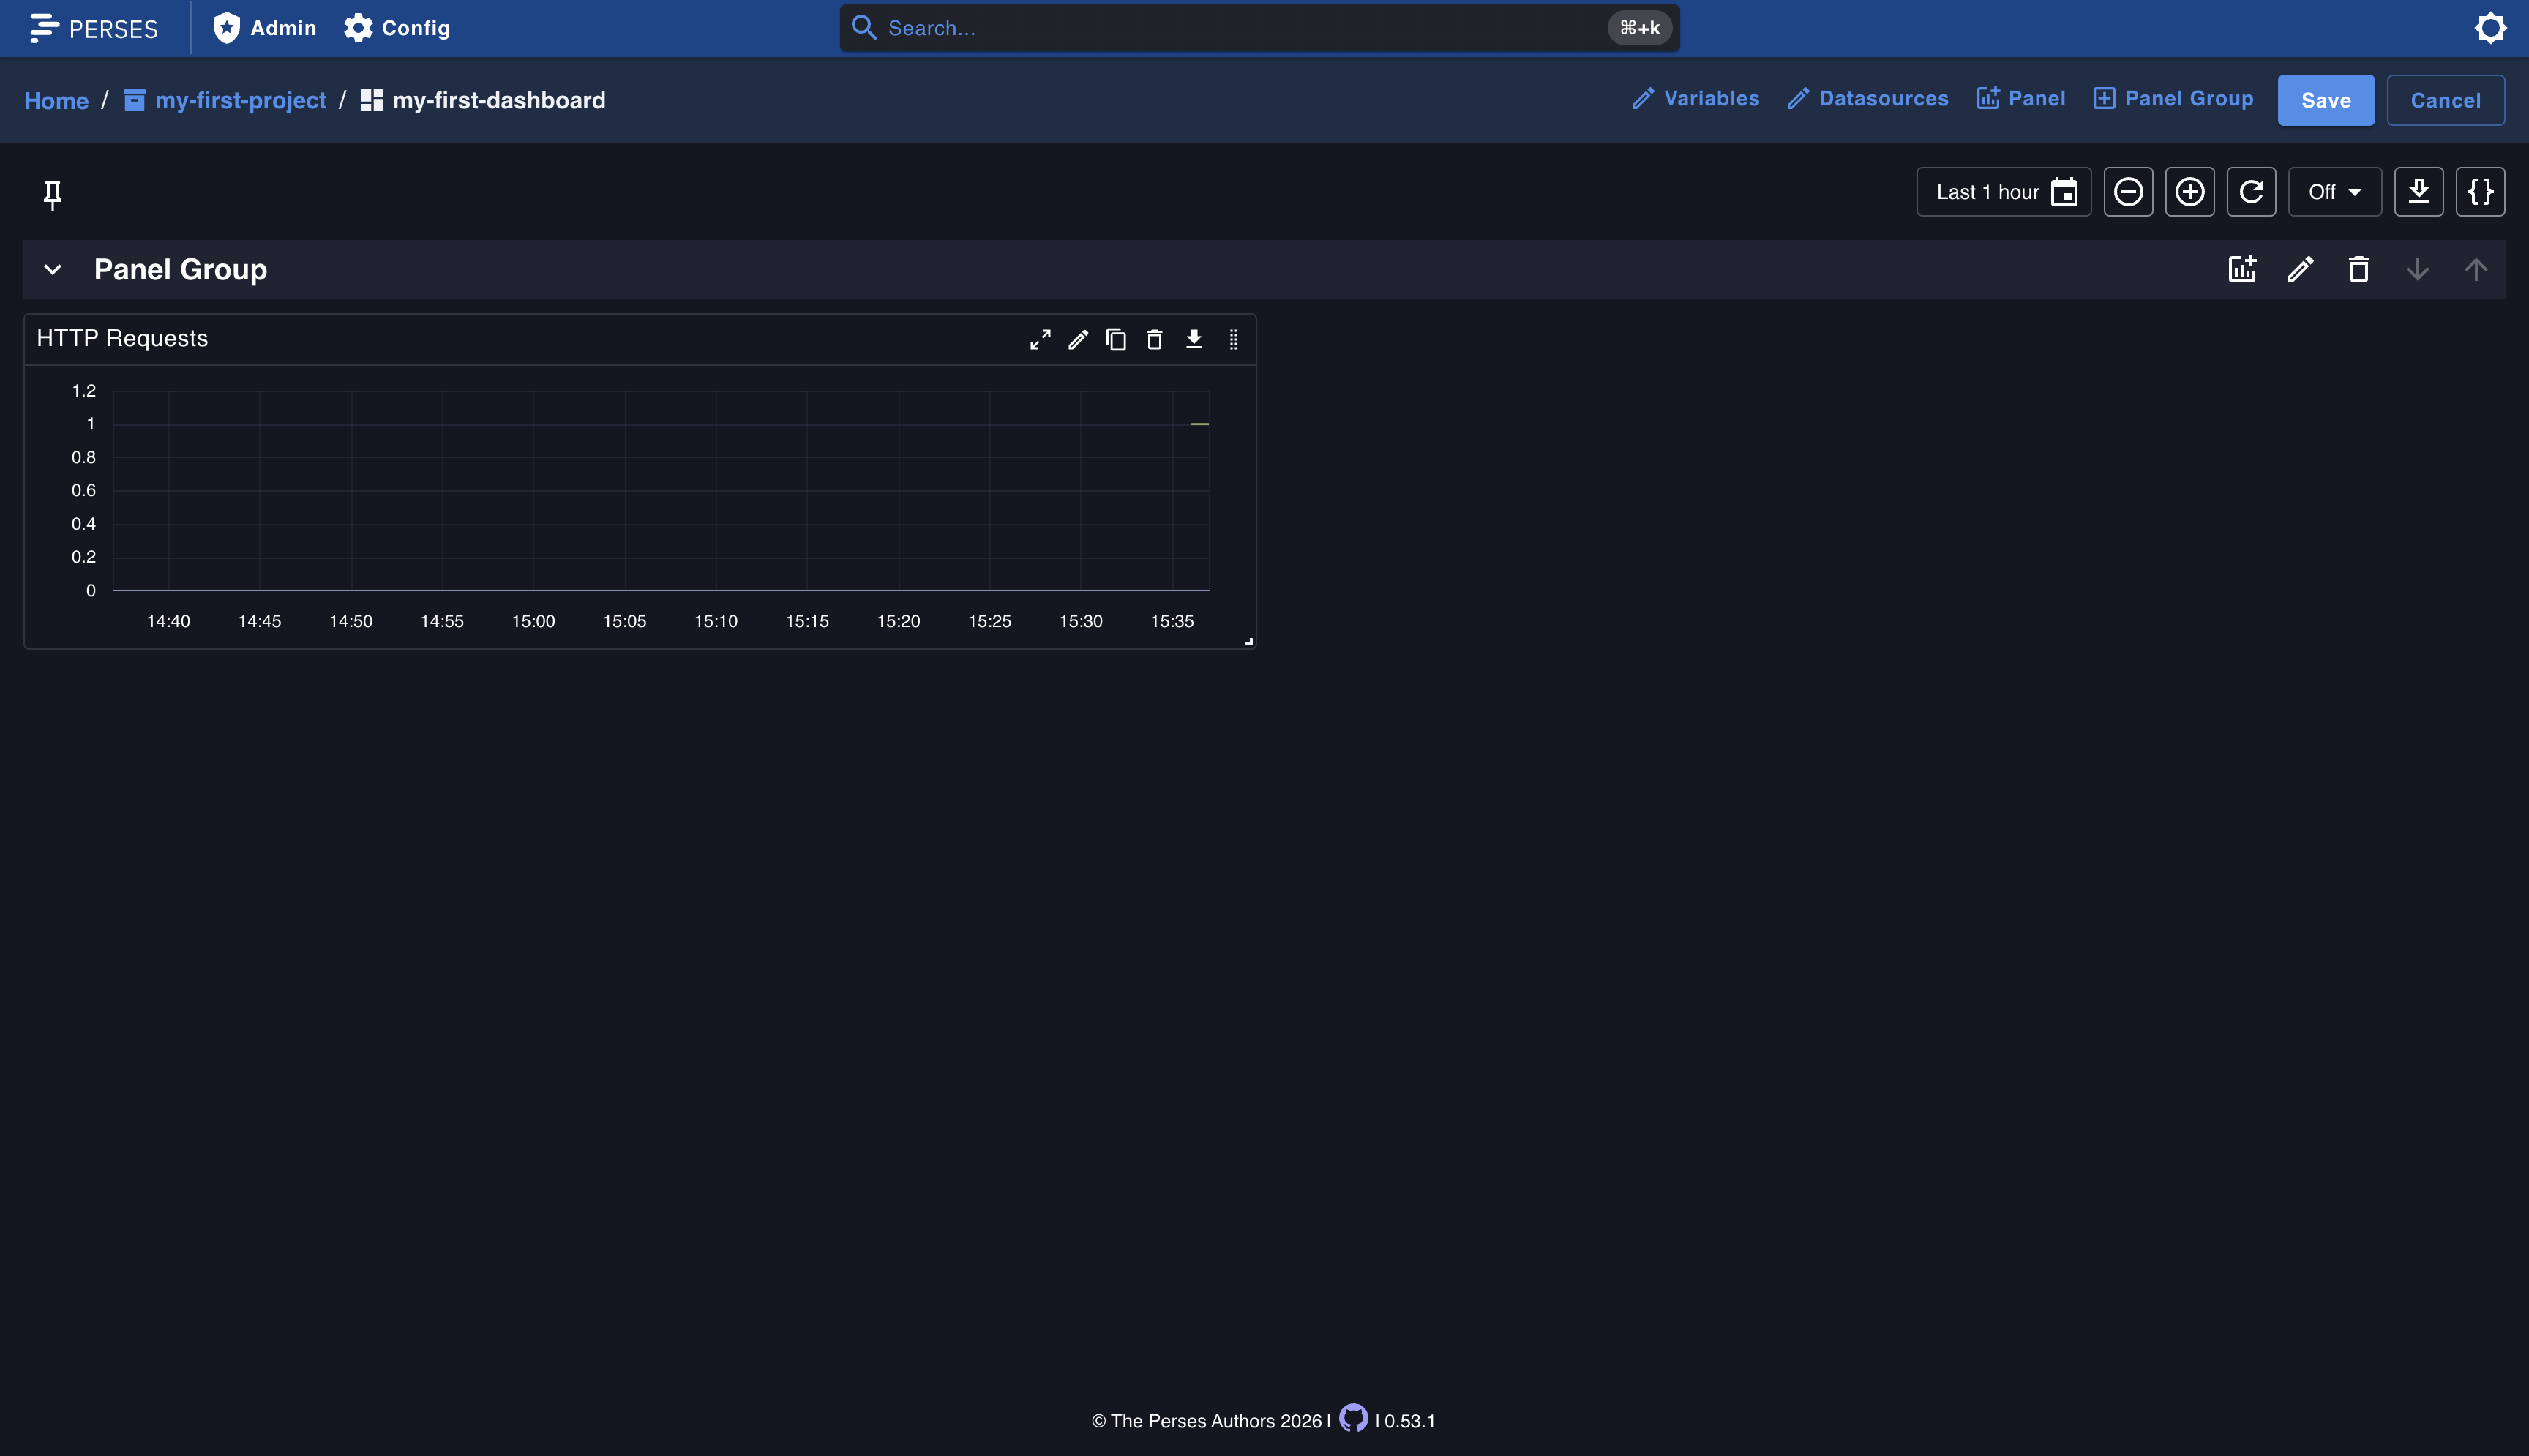
- Click Run Query to preview the chart. You should see a time series line showing the
upmetric. - Click Add to add the panel to your dashboard.
- Click Save in the top-right corner to persist your dashboard.
You now have a working dashboard with a time series panel showing live data from Prometheus.
Exploring Plugins#
Perses is extensible through plugins. Each datasource type and visualization type is implemented as a plugin.
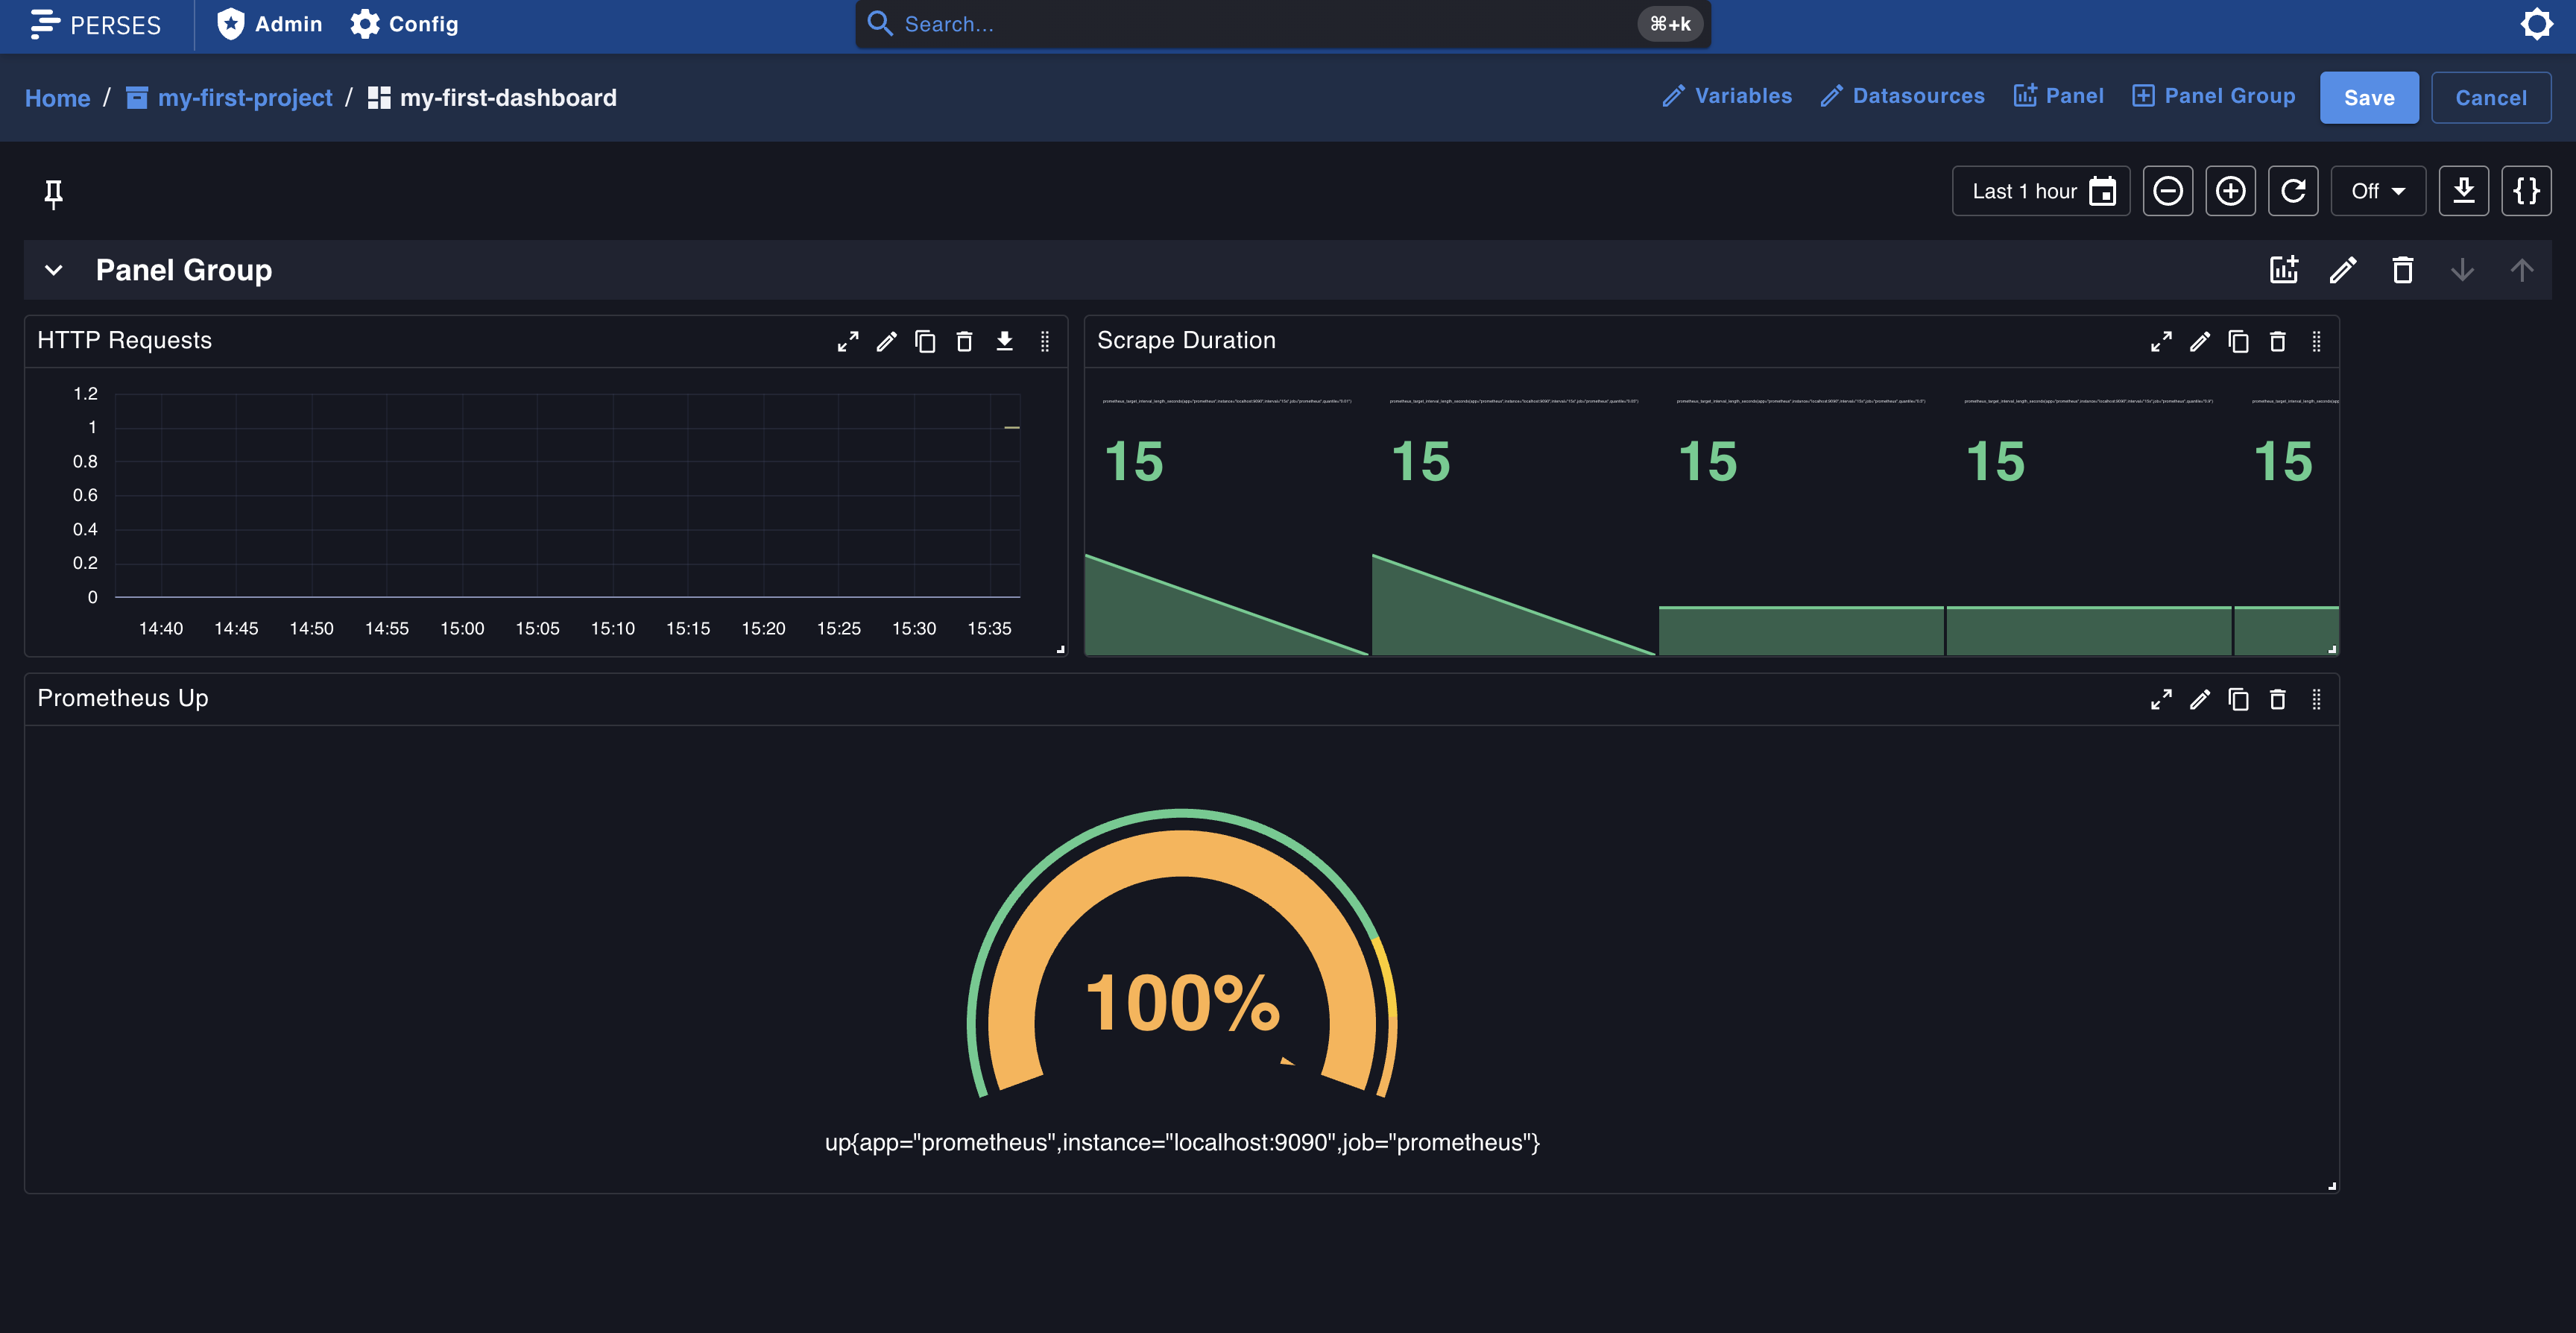
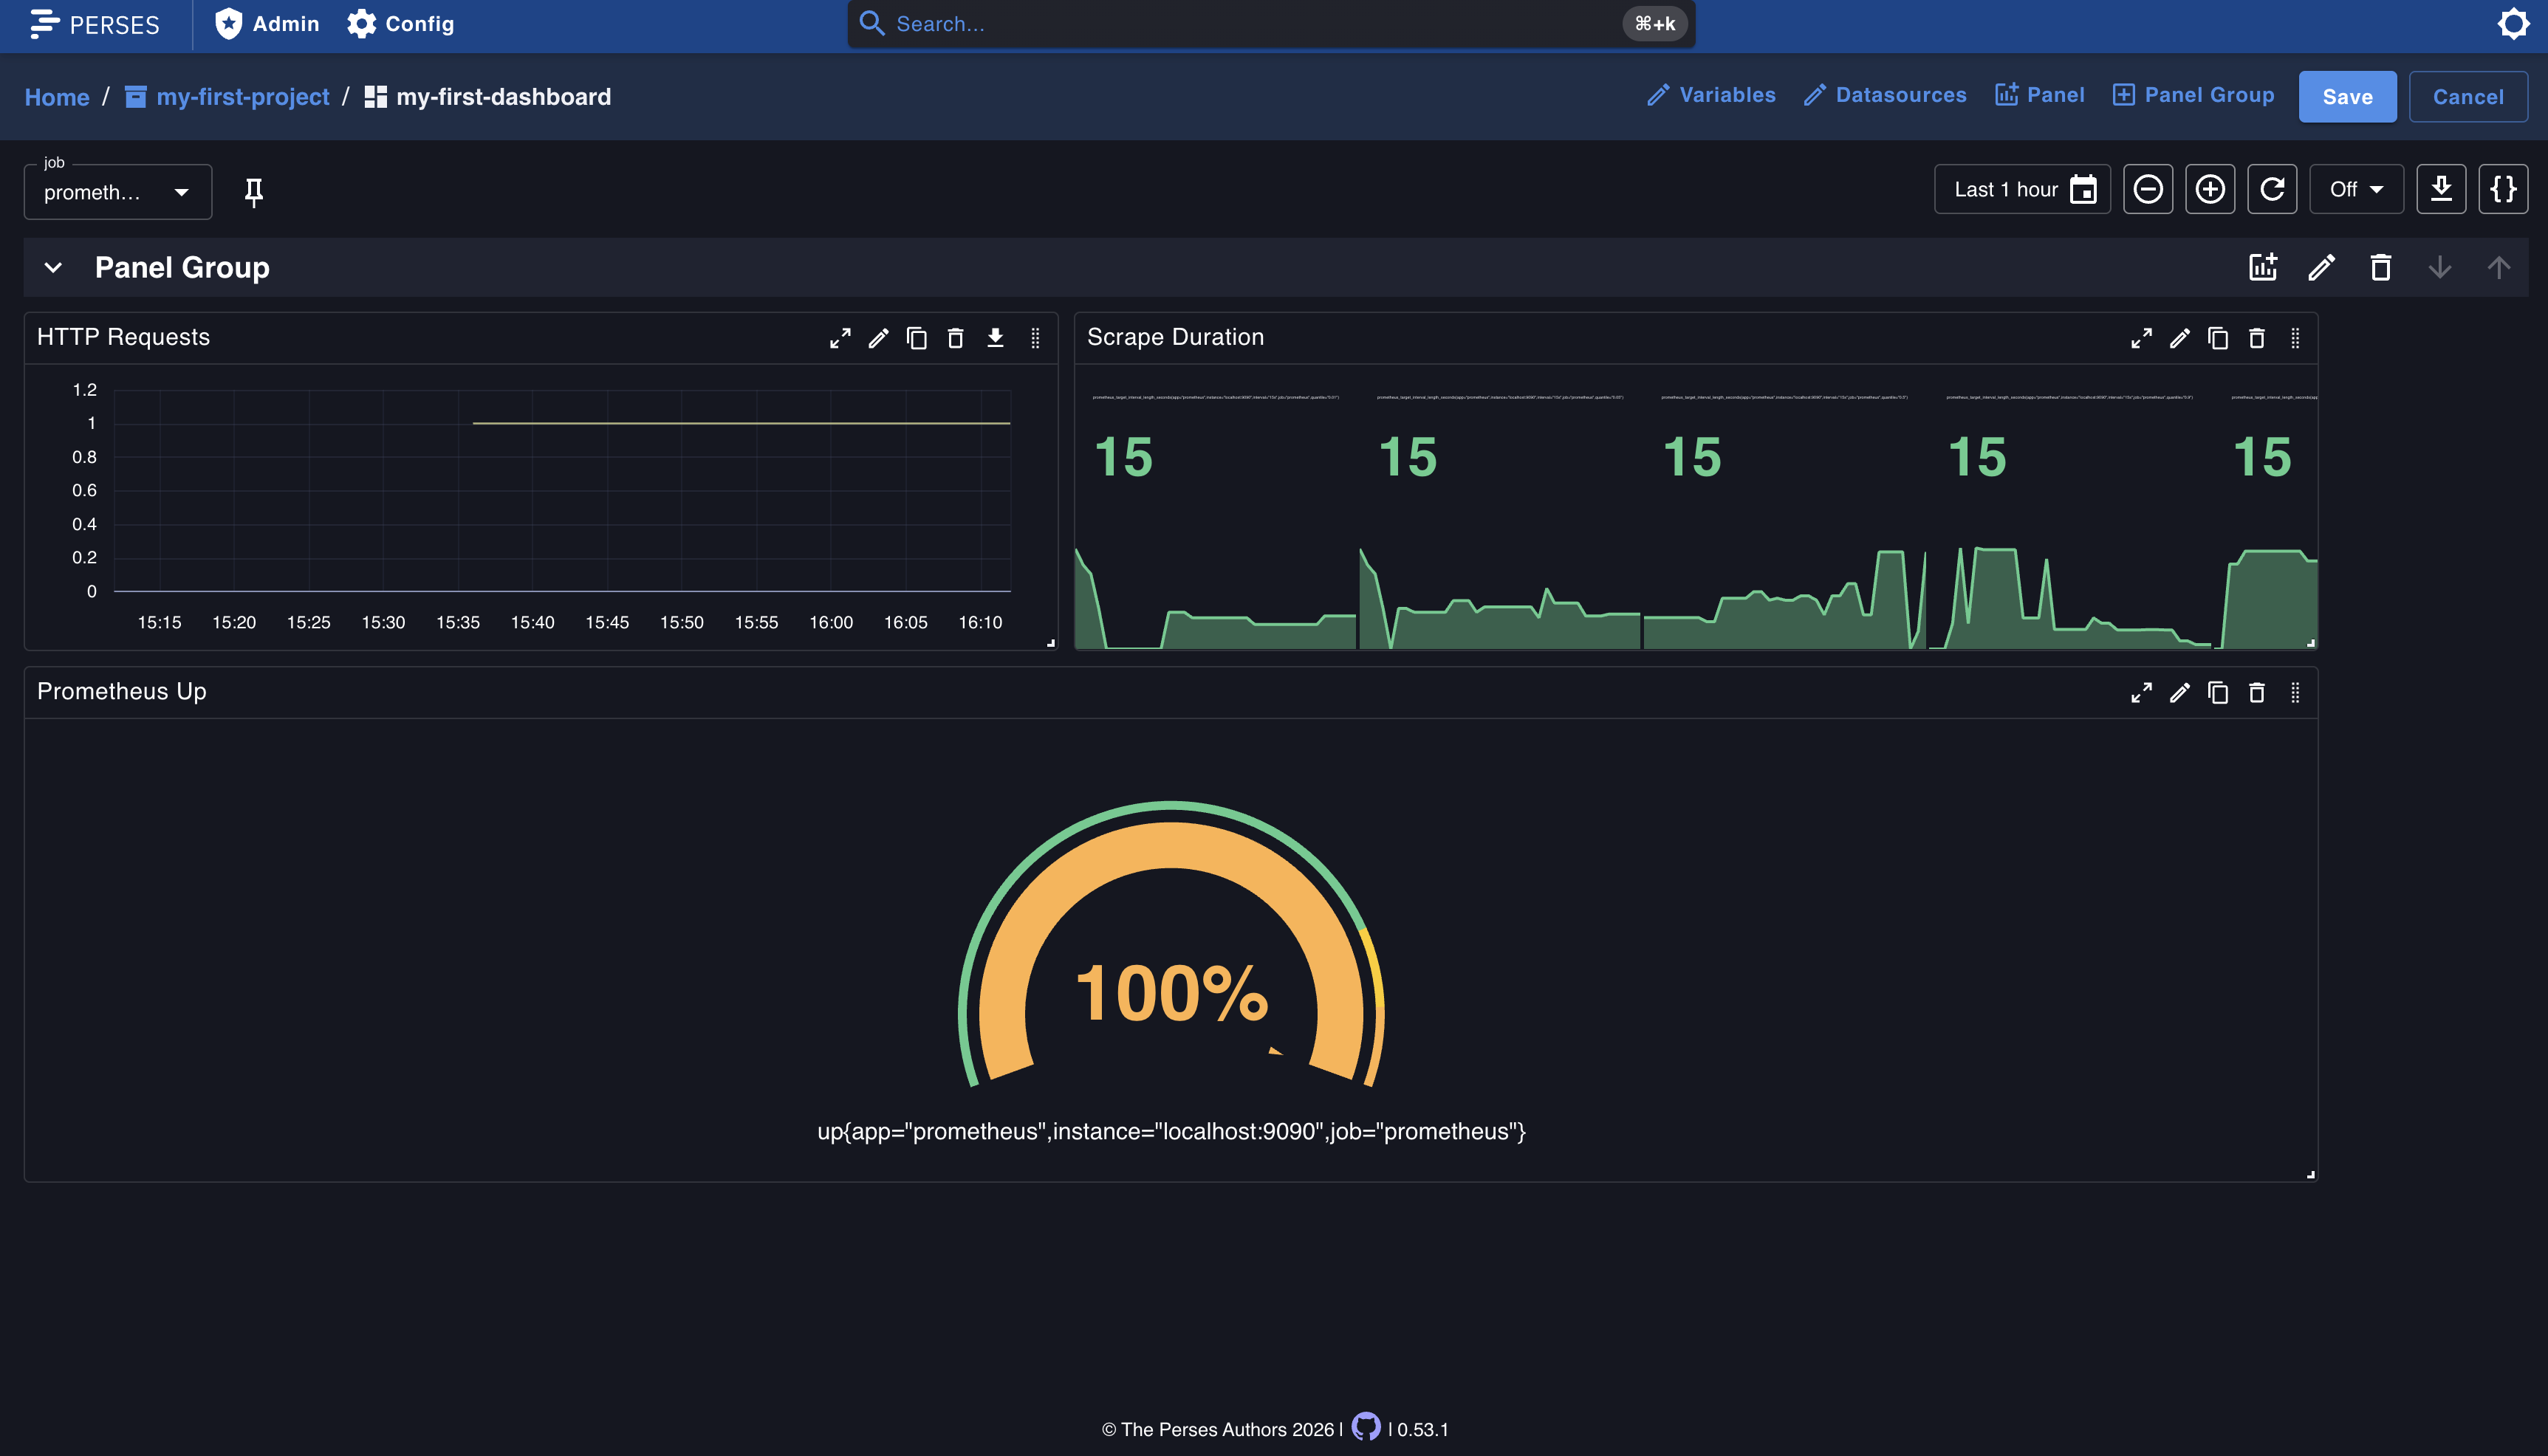
The dashboard you built in the previous section uses a Time Series Chart, but Perses supports several other panel types out of the box. Try adding more panels to see different ways to visualize your data.
More Panel Types#
Open your dashboard in edit mode and click Add Panel. In the Type dropdown you will find options such as:
- Gauge Chart — displays a single value as a gauge. Try the query
upto see a gauge showing 100% when the target is healthy. - Stat Chart — displays one or more values with an optional sparkline. Try the query
prometheus_target_interval_length_secondsto see the scrape interval for each target. - Markdown — renders static Markdown text, useful for adding documentation or notes to a dashboard.
Each panel type is a plugin. For the full list of available plugins and their options, see the plugin documentation.
Variables#
Variables let you create dynamic, reusable dashboards. A variable appears as a dropdown at the top of the dashboard and can be referenced in queries using the $variable_name syntax.
To create a variable:
- Open your dashboard in edit mode.
- Click Variables in the top toolbar.
- Click + Add Variable.
- Fill in:
- Name:
job - Source: select
Prometheus Label Values. - Label Name:
job
- Name:
- Click Run Query to preview the values. You should see the available
joblabel values from Prometheus. - Click Add to save the variable.
- Click Apply to return to the dashboard.
A dropdown appears at the top of the dashboard. You can now use $job in any panel query to filter by the selected value, for example up{job="$job"}.
Dashboard as Code#
Once you are comfortable creating dashboards through the UI, you can manage them as code for version control and automation. Perses supports Dashboard-as-Code with SDKs for both CUE and Go.
Next Steps#
- Dive deeper into Concepts
- Explore the CLI
- Check the API documentation