

An open specification for dashboards. The open dashboard tool for Prometheus and other data sources.
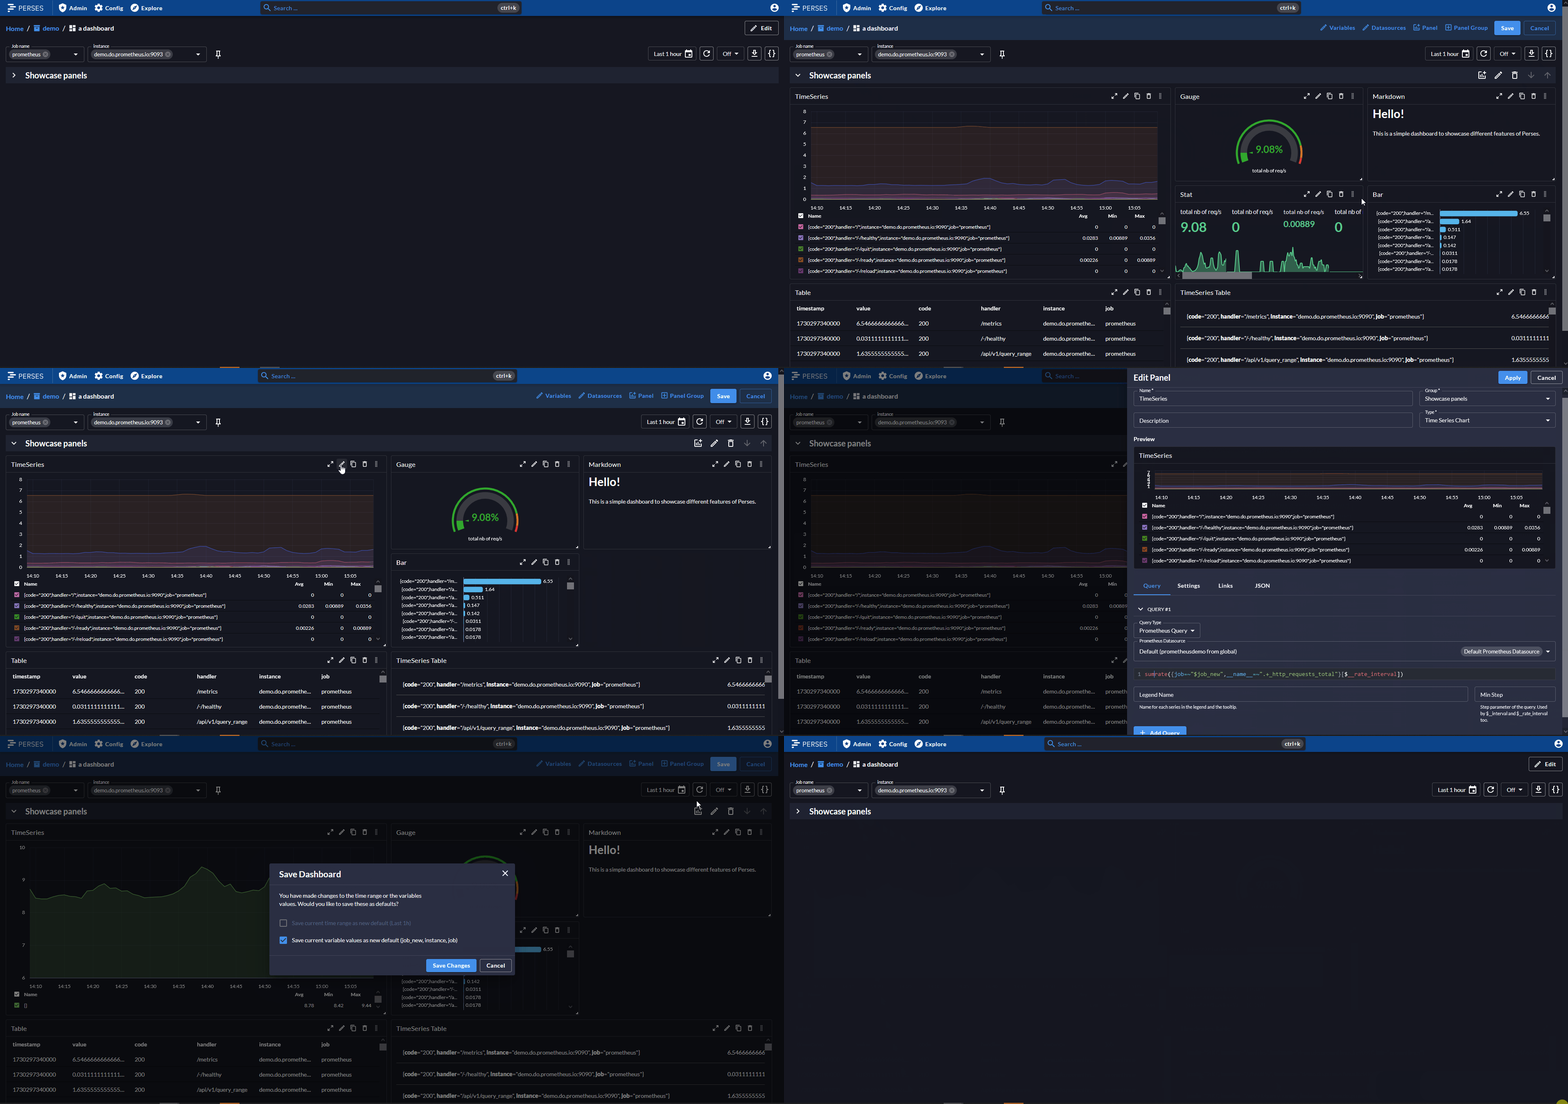
Observability display
Perses is first and foremost a dashboard tool that you can use to display a variety of observability data. It supports all four observability pillars through Prometheus metrics, Tempo traces, Loki logs and Pyroscope profiles. Other supported datasources can be found here.
Embeddable components
You can use Perses as-is or embed parts of it in your own UI as a single panel or a whole dashboard view.
DevOps-ready
Perses offers a complete static validation of the dashboard format. It also comes with a CLI, percli, that can be used to perform actions in CI/CD pipelines.
Scale-friendly
Perses dashboards can be written as code using the provided SDKs, enabling you to manage large numbers of dashboards at scale.
Kubernetes-native
Use the Perses operator to manage your Perses deployments & dashboards as CRDs. Leverage on the datasource discovery to retrieve data from your datasource pods/services.
Extensible
Perses, with its plugin-based architecture, offers effortless extension and reuse of plugins across different projects.
...and more to discover!
Visualize your data
Monitoring with Prometheus
Perses provides comprehensive Prometheus support with specialized panels for metrics visualization. It also comes with a built-in metrics explorer and a PromQL debugger that mirror Prometheus's native UI experience.
Learn moreTracing with Tempo
Deep dive into your Tempo traces and display them in several ways: scatter plots, Gantt charts, or tables.
Learn more
Profiling with Pyroscope
Visualize your Pyroscope profiling data through interactive flame graphs.
Learn morePrometheus, Tempo, Loki, and Pyroscope are just the start. Perses also supports other datasources. → See all supported datasources.
Open ecosystem
Open specification for dashboards
Perses is also an initiative to define a standardized dashboard specification, fostering interoperability across observability tools.
Learn more
Embeddable components
Perses provides various npm packages that allow developers to embed panels and dashboards into their own UIs, giving the flexibility to integrate Perses components without running the full application.
Learn more
Plugins
Perses supports multiple kinds of plugins, enabling users to extend the tool’s native capabilities to suit specific needs.
Learn more
DevOps-ready
percli
Perses comes with a native CLI, percli, which can be used to perform many kinds of actions in CI/CD pipelines.

Dashboard-as-Code
Perses dashboards can be written as code using the provided SDKs. This enables you to define reusable components in libraries or leverage existing community libraries, from simple color codes to complex templates, for reuse across as many dashboards as you want.
Learn more
Static validation
Perses offers complete static validation of the dashboard format, which you can also extend with custom lint rules.
Learn more
Perses operator
Deploy and manage Perses instances and dashboards declaratively using Kubernetes Custom Resources, enabling GitOps workflows and seamless integration with your existing K8s infrastructure.
Learn more
Datasource discovery
Automatically discover and register datasources through HTTP services or Kubernetes API, eliminating manual configuration effort in dynamic environments.
Learn more
And more
Secure your access
Perses provides comprehensive authentication and authorization capabilities. Choose from native user management or integrate with external OIDC/OAuth identity providers. Control access with Kubernetes-inspired RBAC system featuring roles, role bindings, and fine-grained permissions across projects and global resources.
Learn more
Grafana migration
Seamlessly migrate your existing Grafana dashboards to Perses, using either the web UI to import JSON files directly or leveraging percli for batch migrations. The migration process translates Grafana definitions to their Perses equivalents on a best-effort basis.
Resources scopes
Organize datasources and variables across three hierarchical scopes: global (available everywhere), project (shared within a project), and dashboard (specific to one dashboard). Lower scopes automatically override higher ones, enabling flexible resource reuse while allowing targeted customization for specific use cases.
Learn more
Open Source
Perses is 100% open source and community-driven. All components are available under the Apache 2.0 License on GitHub.
Perses is a Cloud Native Computing Foundation sandbox project.


